 Ridge Run Weather Station


Current Space Weather
|
  
|

Current Sunspot Activity
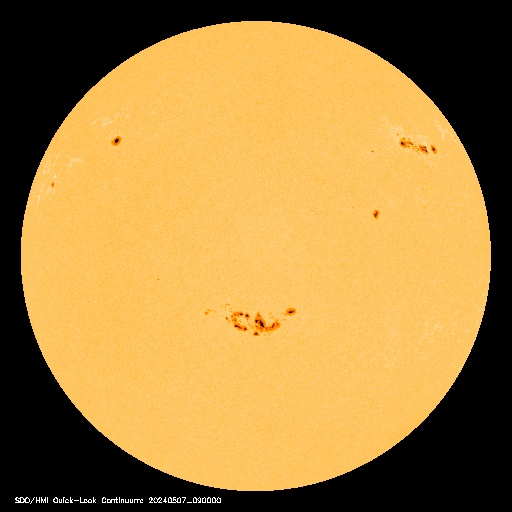 NASA/SOHO |
- Sunspots are solar magnetic storms. The spots appear darker because the temperature of the spots are lower than the surrounding photosphere.
- They serve as a reservoir for solar flares and coronal mass ejections, which cause Aurorae, power/communication outages, and satellite anomalies.
- The Sun's activity waxes and wanes in an 11-year sunspot cycle; Solar Minimum is when the number of sunspots are lowest.
- There seems to be a correlation between Solar Min/Maximum and Earth's weather. The extent to which Ozone, stratospheric winds, global circulation patterns, and cloud seeding are all affected are still being studied.
Sunspot graph courtesy: Newquay Weather

 |
Solar Radiation Storms:
The Proton Flux shows the last 3 days of data for the most dangerous part of a Solar Storm; Solar Radiation. Note the left side Particles value of 101 through 105 MeV for the red band, and the duration of the storm. Match with the Solar Radiation Storm column in the scale. |

|
Radio Blackouts: This plot
shows the last 3 days of Solar X-ray values for the part of Solar Storms causing radio blackouts. Note the left side (W/m2) of 10-5 through 10-2 and note the right side M or X. Match with Radio Blackouts column in the scale. Affected Freqs eg. An Xray Flux of 10-3 in the X20 range (very top plot w/out a value in the right side) is indicative of an EXTREME (R5) event-radio blackout on the entire sunlit side of Earth lasting for a number of hours. |
 |
Geomagnetic Storms This
plot shows Geomagnetic Storm strength. Note the left side Kp value of 5 through 9 (<5 not an event) and
duration. Match with the Geomagnetic Storm column in the
scale.
eg. A Kp 7 event is a STRONG (G3) event-HF radio may be intermittent, and aurora have
been seen as low as Illinois and Oregon. |
Real Time Auroral Oval and Magnetopause
 |
Real time data from the ACE spacecraft (top two panels)
are used to predict the shape and location of these boundaries at the
present time and into the near future (The time is Universal Time as
measured at Greenwich, England. In the figure to the right, the Earth is in the center, and is illuminated from the left by the Sun (not shown). In this view, we are looking down upon the North pole; thus the figure represents the equatorial plane. The solar wind emanating from the Sun is super-magnetosonic with respect to the Earth, so that a shock wave is formed. As the solar wind flows through the shock it is slowed down, and the pressure of the solar wind is balanced by the pressure from the Earth's magnetic field. The boundary at which this pressure balance is achieved is called the magnetopause. The ACE spacecraft monitors the solar wind from a position about 200 Earth radii (RE) sunward of the Earth. The real time solar wind data from this spacecraft allows us to predict what will happen at the Earth many minutes before the solar wind actually reaches us. Important solar wind values obtained from the ACE observations include the z-component of the interplanetary magnetic field (Bz) measured in units of nano-Tesla, and the dynamic pressure (also called the momentum flux) of the solar wind, measured in units of nano-Pascal. Geosynchronous orbit (where many weather and communication satellites orbit) is depicted by the green dashed circle. This plot shows Real Time Magnetopause courtesy: The Polar Ionospheric X-ray Imaging Experiment (PIXIE) |
 |
 |
 |
IMF Dials courtesy: Rice Space Institute

|
This plot shows the real time Aurora Forecast.
Aurora Forecast courtesy: http://helios.swpc.noaa.gov
Radio Propogation

IPS Space Weather
Solar Activity Monitor
The monitor in the page heading provides a textual status of X-ray activity and refers to the X-Ray Flux graph at the top of the page.| NORMAL | Solar X-ray flux is quiet (<1.00e-6 W/m^2). |
| ACTIVE | Solar X-ray flux is active (>= 1.00e-6 W/m^2). |
| M CLASS FLARE | An M Class Solar Flare has occurred (>= 1.00e-5 W/m^2). |
| X CLASS FLARE | An X Class Solar Flare has occurred (>= 1.00e-4 W/m^2). |
| MEGA FLARE | An unprecedented X-ray event has occurred (>= 1.00e-3 W/m^2). |
Script courtesy of: Lee from MadALwx.
Graph base code courtesy of: jpGraph.
